Ever since I wrote the Swap Adjacent article on matching tile games, I have been fascinated with the challenge of writing, and visualizing the history of art forms.
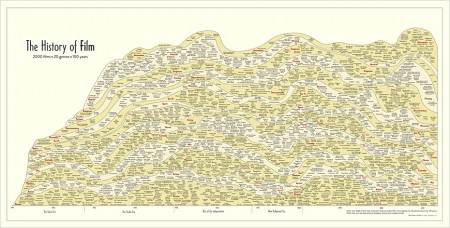
Here is Larry Gomley’s History of Film poster (clearly inspired by Reebee Garofalo’s genealogy of Pop/Rock music), in which we can see the major genres developing over time.
Before we pile on the criticism (US-centric etc..), there are three major reasons for attempting things like this:
- It is an interesting way of condensing a large amount of information into a snapshot.
- The process of reducing thousands of works into an overview is in itself interesting: how are we thinking about these things, and how would we express them visually?
- Some of us ( me for example) were told in no uncertain terms during our university education that you just can’t write histories like this. So let’s do it!


I just love it! Something similar would be interesting to do in games. I tried to do some related stuff with Espen’s model but I think it needs a data set with at least 50 different games / year. For some of the clustering algorithms for visualization they also have to be unique which then limit the ability to study the introduction and extinction of specific genres.
Best to you Jesper! And happy Halloween or what you have over there this weekend. ;-)
There is certainly something cool about infographics and the whole idea of visualizing complex relationships and histories. However, games are really such complex objects that can include so many traits from other art forms that it’s hard to formalize without ending up with somewhat arbitrary categories. I examined a framework for game data collecting and formalization in an ITU project once, and wanted to use Mobygame’s game database as a starting point – but they were reluctant to share the raw data for scientific purposes. However, they later added to their database the current system of arbitrary ‘game categories’ – a concept very similar to my own idea. So now two or more games can be grouped by any common trait between them, whether it’s related to content, sub-genres, production, etc. So apart from genres and release dates, you now have lists of games with female protagonists, games featuring blacksmithing, games where the player can drive a Toyota, and tons of other categories. It’s actually a great resource for exploring certain motives and trends in game history, and I suppose you could still find some interesting trends or meta-categories by crunching all the data. If they let you ;)
@Steve @Frederik I like the idea of making histories like this automatically, but I think that it in many ways is even more interesting to deliberately design one subjectively. The problem with the data-based systems is that the weighting of the parameters can only be arbitrary decisions.
The more subjective designs like the one above force you to more openly consider and state how you are weighing parameters against each other.
Anyone found a way yet to download the full original image file?
Franco Moretti’s Graphs, Maps, Trees: Abstract Models for a Literary History (2005) is an interesting set of studies in this direction. Though judging by reviews of his book in literary-theory journals, it seems there is still quite a lot of resistance to writing histories in this way.
@Mark Yes, that book is also quite interesting!
I was wondering if anyone has tried to make a visual history of programming languages?
@Jesper I’ve seen this poster from O’Reilly in the halls of several computer-science departments. They credit some diagrams by Éric Lévénez with inspiring it.
On a related topic (summary diagrams I’ve seen in the halls of CS departments), there’s a company that produced a series of posters mapping out the “can computers think?” debate in a form they call “argument mapping”. It’s a bit more like a flow-chart than something that gives you a real visual overview of the debate at a glance, though. Maybe more like a concise choose-your-own-adventure way of summarizing.
@Mark The programming language map is nice, but I wonder if it is a bit limited in terms of inspiration. For example, Basic only leads to VB.Net and isn’t inspired by anything.
The argument map is quite interesting.
But can anyone actually read it? I only get to a fuzzy unreadable image. Please post instructions.
Got it. Distracted by black links.